Building Blocks – Statistical Diagrams
Free
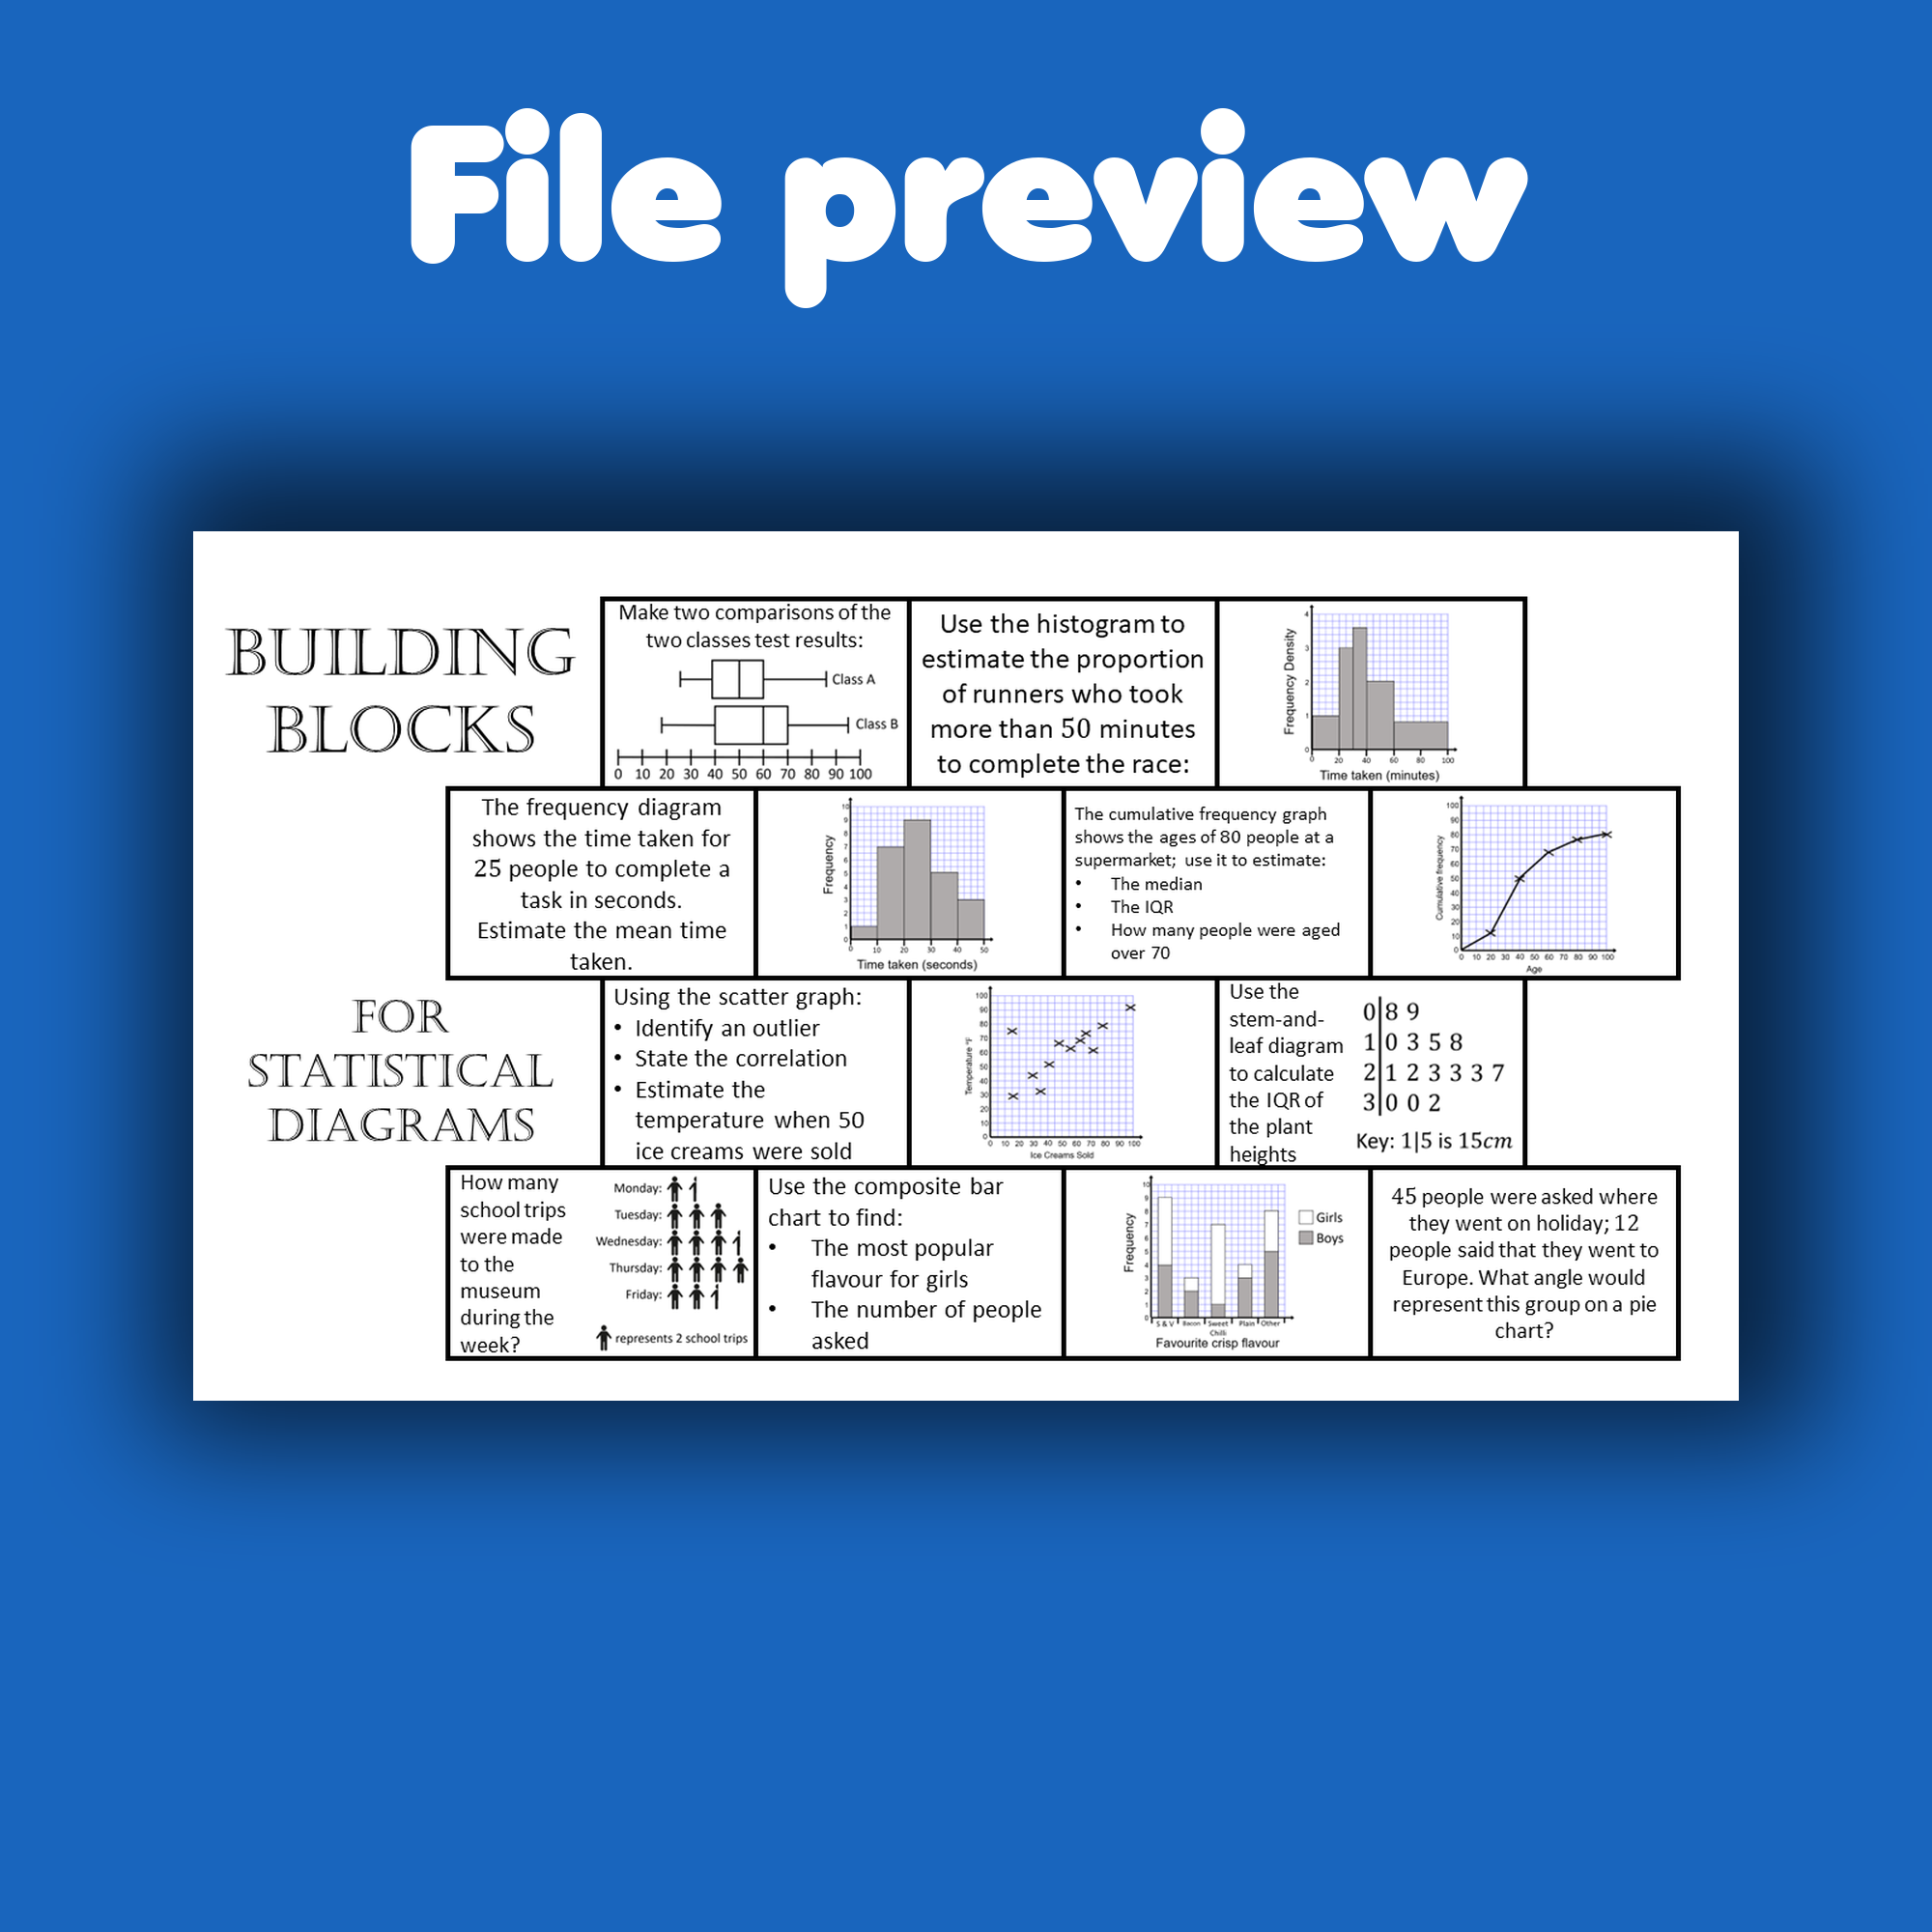
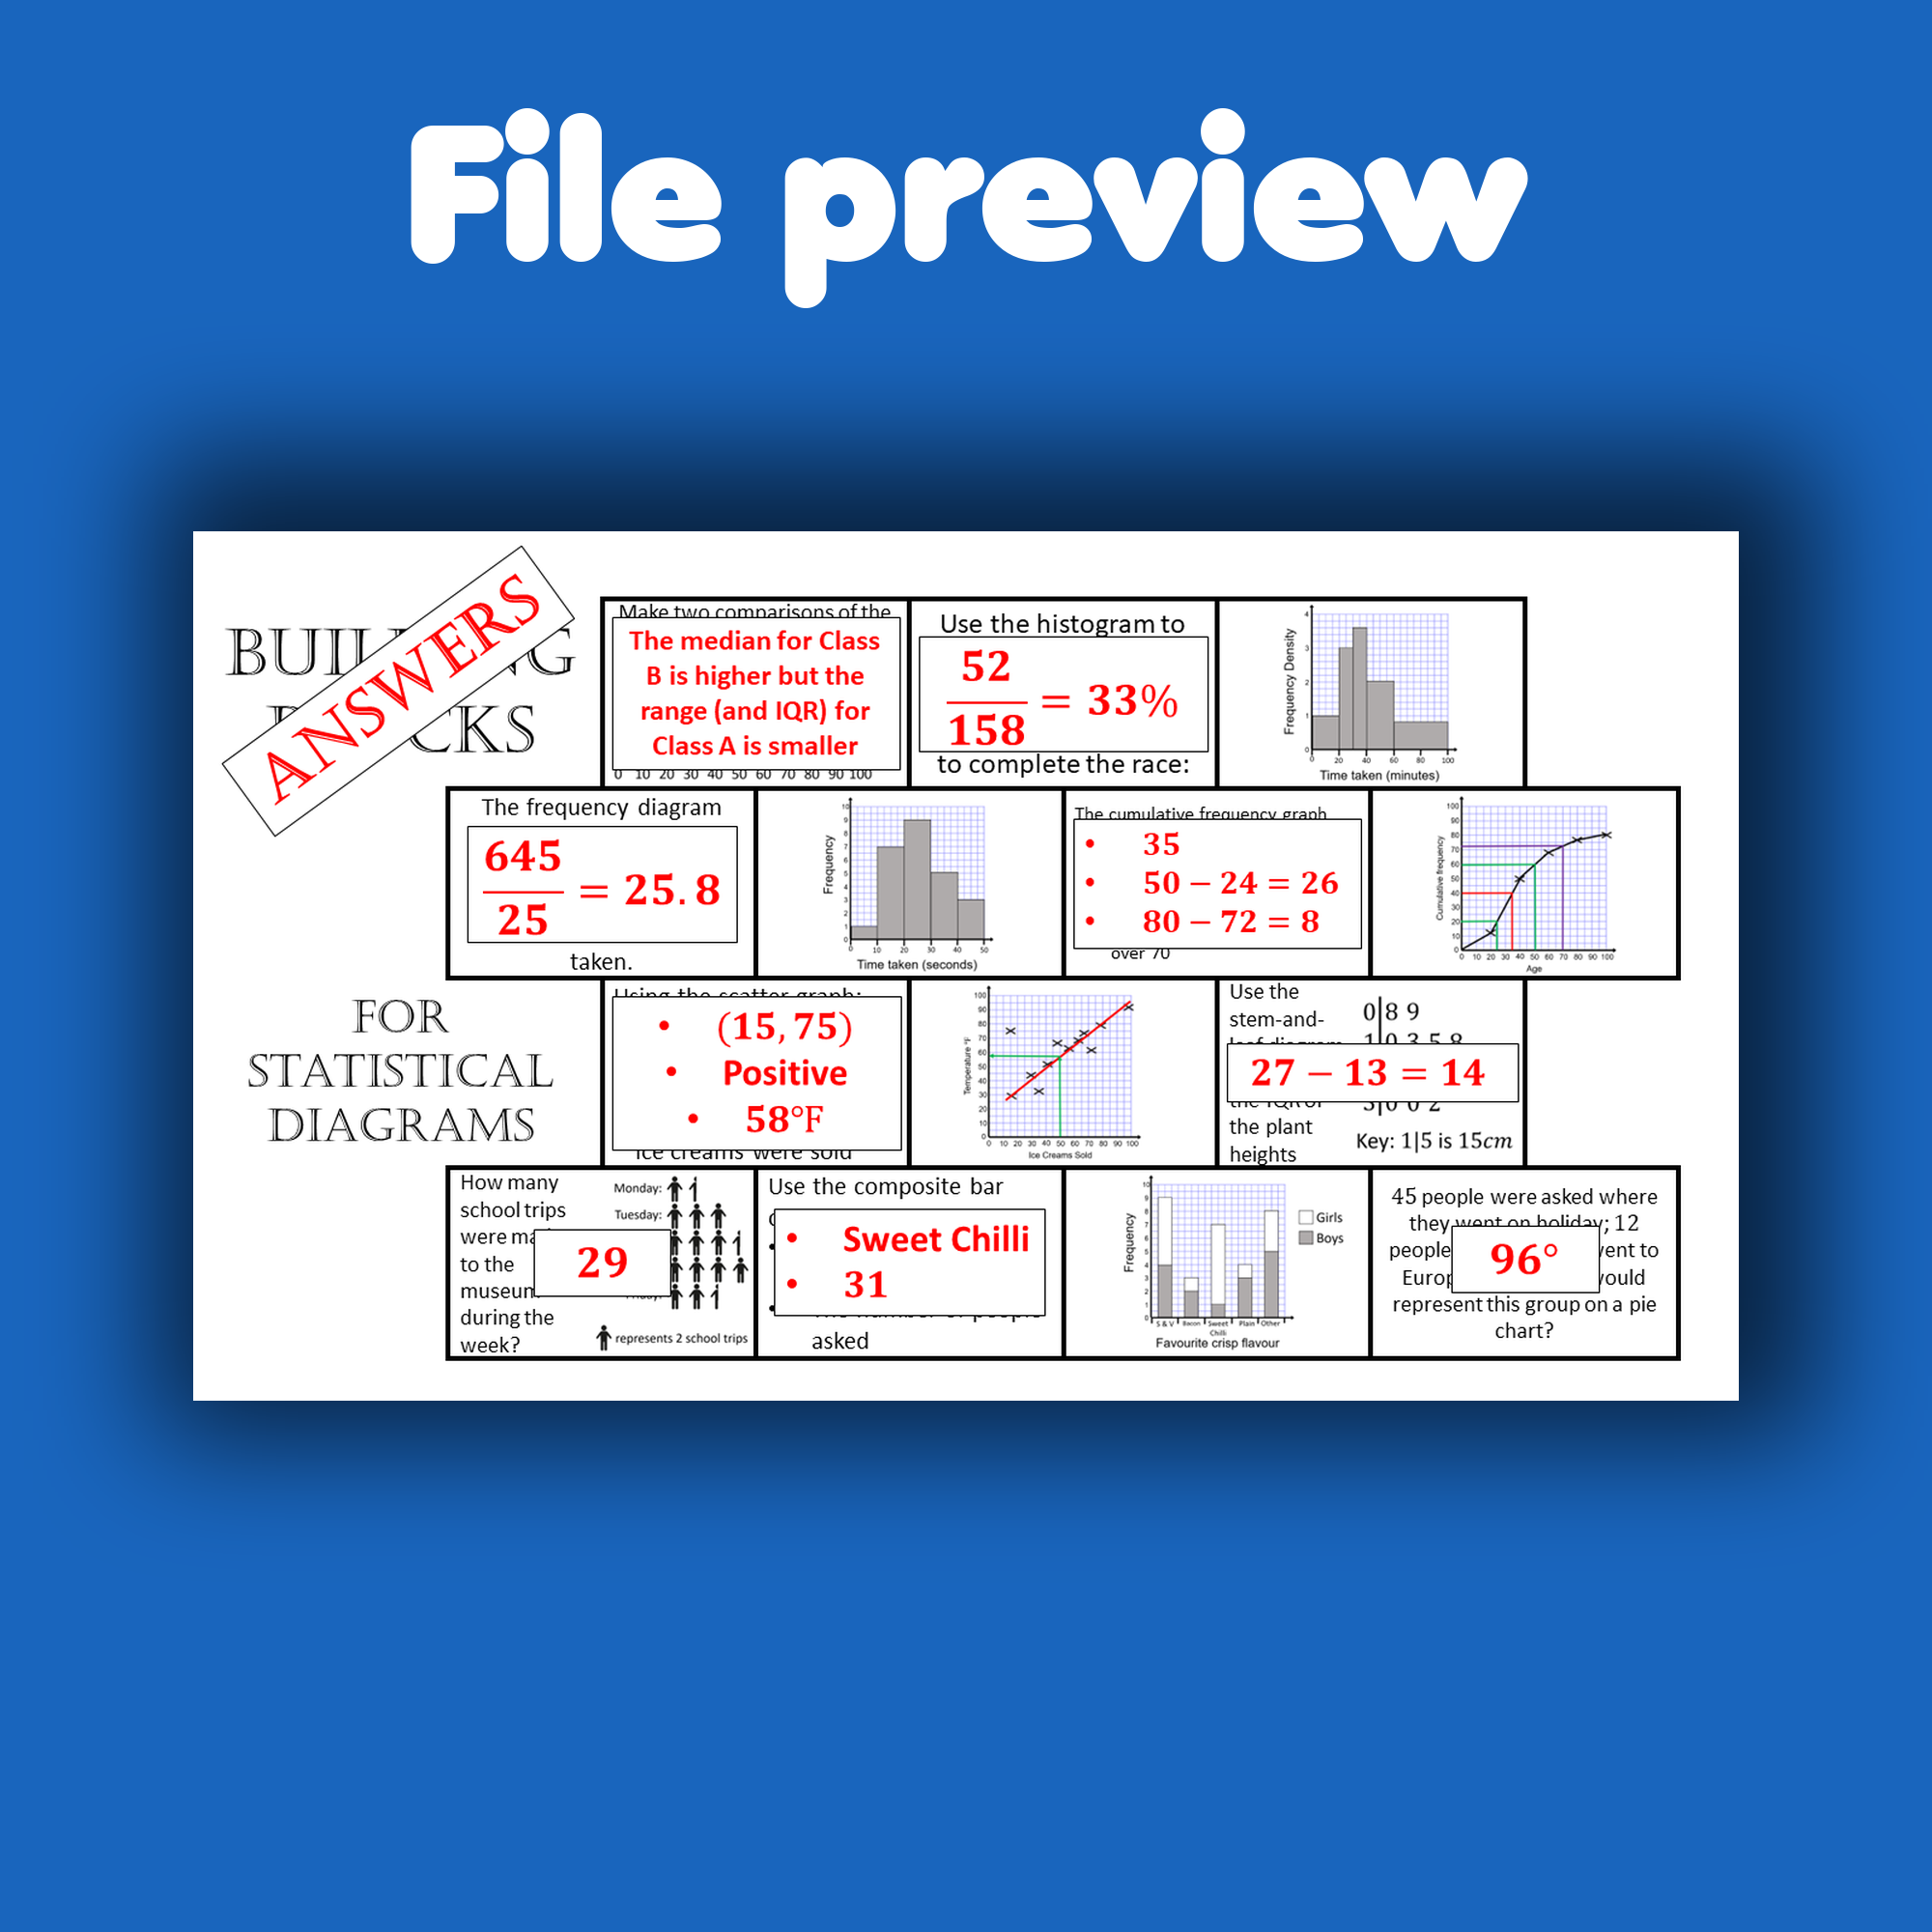
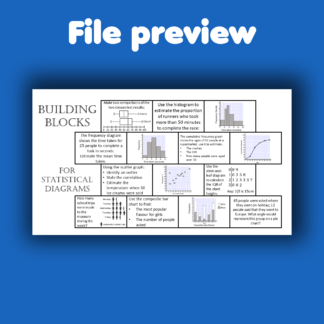
Taking students all the way from pictograms, through bar charts, pie charts, stem-and-leaf, scatter graphs, frequency diagrams, cumulative frequency, box plots and histograms. The graphs are as large as I can make them and should be ok if copied on to A4.
Additional information
| Resource type | |
|---|---|
| Age range |
SKU: 12126521
Categories: Data Processing, Data Representation, Handling Data
Description
Taking students all the way from pictograms, through bar charts, pie charts, stem-and-leaf, scatter graphs, frequency diagrams, cumulative frequency, box plots and histograms. The graphs are as large as I can make them and should be ok if copied on to A4.
This free resource contains:
- 1 pptx file (554.59 KB)
Got a specific question about this resource? Ask me on Twitter @andylutwyche
I hope you find this resource helpful!
-Andy Lutwyche

