What Was The Question? – Statistics Edition
Free
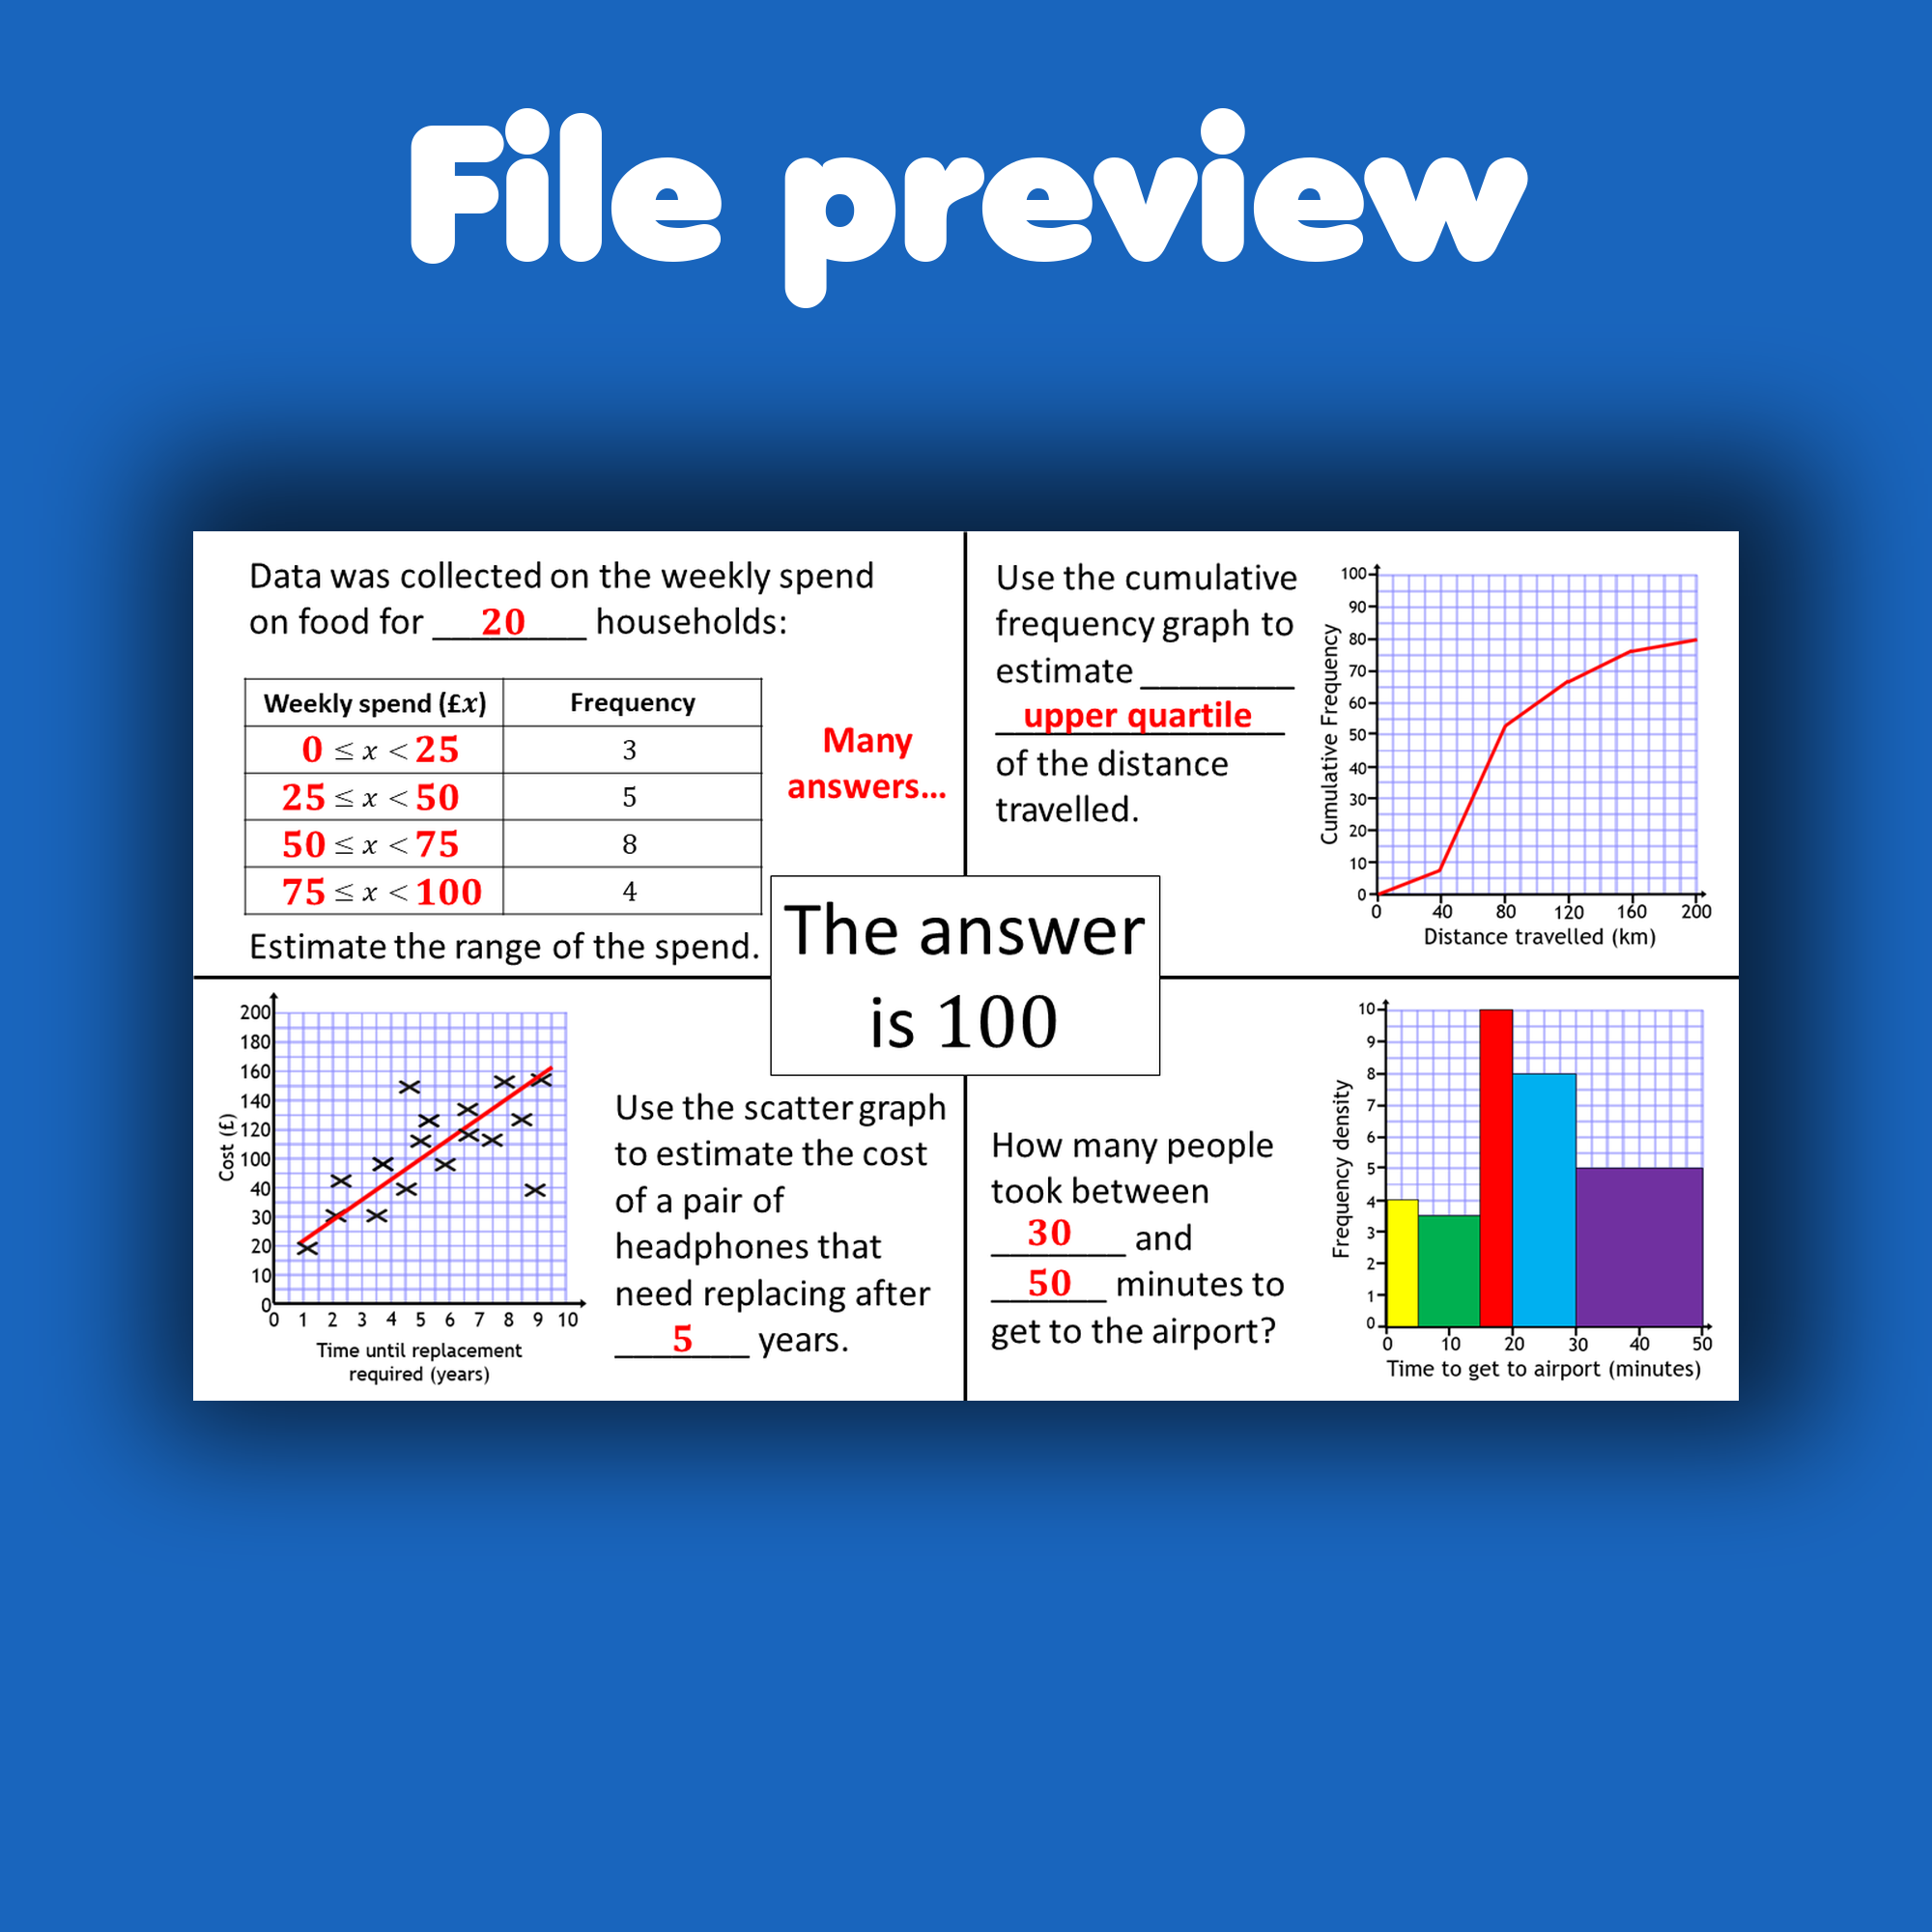
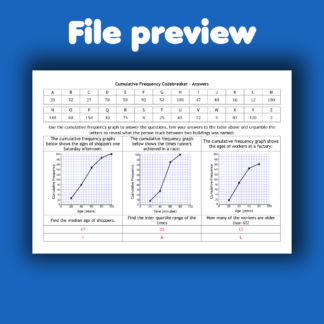
This is four sets of four questions on statistics, mainly involving statistical graphs including pictograms, bar charts, pie charts, frequency diagrams, scatter graphs, cumulative frequency, box plots and histograms. They get increasingly more difficult as you work your way through them. The answers are given but elements of each question are missing in each case and students are required to fill in the blanks so that the questions work. This is designed to create discussion and allow students to demonstrate that they can interpret statistical graphs.
Additional information
| Resource type | |
|---|---|
| Age range |
SKU: 12286629
Category: Data Representation
Description
This is four sets of four questions on statistics, mainly involving statistical graphs including pictograms, bar charts, pie charts, frequency diagrams, scatter graphs, cumulative frequency, box plots and histograms. They get increasingly more difficult as you work your way through them. The answers are given but elements of each question are missing in each case and students are required to fill in the blanks so that the questions work. This is designed to create discussion and allow students to demonstrate that they can interpret statistical graphs.
This free resource contains:
- 1 pptx file (548.53 KB)
Got a specific question about this resource? Ask me on Twitter @andylutwyche
I hope you find this resource helpful!
-Andy Lutwyche


